Course Content
Lecture 4: DAX for Dynamic Analysis
Develop powerful calculated measures and KPIs with DAX. Learn core and advanced functions to unlock interactive and insightful dashboards.
0/7
Lecture 5: Data Visualization Fundamentals
Understand data storytelling and visualization principles — how to choose the right charts, apply color psychology, and present insights effectively.
0/7
Lecture 6: Dashboard Design & Layout
Take your dashboards to the next level by learning professional layout structures, layering visuals, consistent branding, and responsive design best practices.
0/7
Lecture 7: UX Design & Interactivity (Buttons, Filters & Navigation)
Bring dashboards to life! Learn how to use buttons, slicers, bookmarks, tooltips, and navigation menus to create a seamless and interactive user experience in Power BI.
0/6
Graduation project Sales Reporting & Analysis Project Guide
0/2
Advanced Session: Real-World Deployment & Security
Deploy your project professionally — learn how to publish reports, manage workspaces, apply Row-Level Security (RLS), and share dashboards safely with teams or clients.
0/1
Power BI Developer Diploma

Dive into Power BI Desktop and get hands-on with the Home, View, and Modeling tabs. Then, uncover the Business Intelligence Life Cycle — from data collection to analysis and action — to understand how Power BI fits into end-to-end BI processes

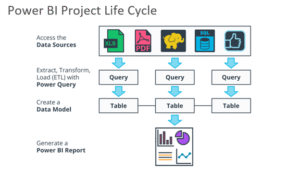
🔄 The BI Life Cycle Steps:

  1. 🧠 Gathering Requirements – Define your business goals, assess challenges, and plan your analysis roadmap.
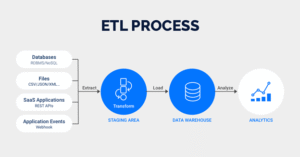
  2. 🧹 Preparing Data – Design your data model, clean your data, and build your data warehouse.
  3. 📊 Analyzing & Reporting – Transform your data into stunning interactive dashboards and reports.
  4. 🚀 Taking Action – Use insights to drive data-backed decisions and measure KPIs effectively.
  5. 🔁 Repeating the Cycle – Continuously improve by reviewing outcomes and refining your BI strategy.


0% Complete
DataSkool
Logo
Shopping cart